Simulation Output Data
Main Page > Technical Documentation > Simulation Output Data
Multiple types of data/performance measures can be selected for output, as selected from the simulation control panel. These files get written to the output data folder selected in the project properties dialog. The various performance measures included in these output files are described in the Performance Measures section.
Vehicle Headway Data
This file contains the headway value for each vehicle generated into the network, from each entry node. It is in a comma-separated value (CSV) format. The CSV file is named "HeadwayDataOutput.csv". This file will contain the following information:
- Node ID: ID of entry node where vehicle entry headway was generated.
- Vehicle ID: ID of vehicle to which generated entry headway applies.
- Original Headway Value (s): See Vehicle Generation for more information.
- Revised Headway Value (s): If a very small headway value is generated, the program checks that the vehicle entering with this headway will not potentially collide with the preceding vehicle that entered, if on the same lane. This can happen if the entry speed (based on desired speed) of the subject vehicle is greater than the speed of the preceding vehicle. If a collision is possible, the program adjusts the generated headway value to avoid a collision. Link to details about this process forthcoming.
Link Performance Measure Data
This file contains link-level performance measures. It is important to note that detector actuations that occur during the warm-up time are not included in the results reported in this file. It is in a comma-separated value (CSV) format and named "LinkResults.csv". The file contains the following information:
- Scenario: Corresponds to scenarios in a multi-run setup. If a single simulation run is made, this number will always be '1'.
- SubScenario: Corresponds to scenarios in a multi-run setup. If a single simulation run is made, this number will always be '0'.
- Replication: The replication number of a single run or the scenario from a multi-run setup.
- Link ID: ID of link containing subject detector.
- Link Type: Entry, Exit, Connector, further classified as Freeway, Highway, or Arterial.
- Density (veh/mi/ln): See Performance Measures for more information.
- Avg. Speed (mi/h): See Performance Measures for more information.
- Avg. Travel Time (s): See Performance Measures for more information.
- Accel Noise-Mean Zero (ft/s/s): See Performance Measures for more information.
- Accel Noise-Mean NonZero (ft/s/s): See Performance Measures for more information.
- Flow Rate (veh/h/ln): See Performance Measures for more information.
- Num. Passenger Cars: Count of passenger-style vehicles that entered and exited the link. Vehicles that entered the link during the warm-up time or were still on the link when the simulation ended are not counted. The same applies for the following vehicle types.
- Percentage of Passenger Cars: Percentage of all vehicles that passed through the subject link that were passenger-style vehicles.
- Num. SUT (Single Unit Truck): Count of SUT vehicles that entered and exited the link.
- Percentage of SUT: Percentage of all vehicles that passed through the subject link that were SUT vehicles.
- Num. IMST (Intermediate Semi-Trailer): Count of IMST vehicles that entered and exited the link.
- Percentage of IMST: Percentage of all vehicles that passed through the subject link that were IMST vehicles.
- Num. ISST (Interstate Semi-Trailer): Count of ISST vehicles that entered and exited the link.
- Percentage of ISST: Percentage of all vehicles that passed through the subject link that were ISST vehicles.
- Num. DST (Double Trailer Semi-Trailer): Count of DST vehicles that entered and exited the link.
- Percentage of DST: Percentage of all vehicles that passed through the subject link that were DST vehicles.
- Total Num. Vehicles: Count of all vehicles that entered and exited the link. This value should match the sum of the counts of passenger, SUT, IMST, ISST, and DST vehicles.
- Veh. Hours traveled (veh-h): See Performance Measures for more information.
- Veh. Miles traveled (veh-mi): See Performance Measures for more information.
- Delay Left Turn Vehicles (veh-s): See Performance Measures for more information.
- Delay Through Vehicles (veh-s): See Performance Measures for more information.
- Delay Right Turn Vehicles (veh-s): See Performance Measures for more information.
- Volume Left Turns (veh): Count of vehicles that made a left turn from the subject link.
- Volume Through (veh): Count of vehicles that made a through movement from the subject link.
- Volume Right Turns (veh): Count of vehicles that made a right turn from the subject link.
- Total Stops: See Performance Measures for more information.
Detector Vehicle Actuation Data
This file contains the details of each actuation for a given detector during the simulation. One comma-separated value (CSV) file will be created for each detector. Each CSV file will be named as follows:
"Link_i_Lane_j_Detector_k_Detector Label_x_z.csv"
where:
i corresponds to the Link ID of the link containing the detector,
j corresponds to the Lane ID of the lane containing the detector,
k corresponds to the Detector ID,
Detector Label is the text string entered in the detector label field in the detector setup dialog,
x corresponds to the scenario number, and
z corresponds to the replication number.
The (CSV) file will contain the following information.
- The following values are fixed for each file; thus, they are printed just once at the top of the file.
- Link ID: ID of link containing subject detector.
- Lane ID: ID of lane within link containing subject detector.
- Detector ID: ID of subject detector. These values are unique to each link and lane. That is, the first detector placed in each lane of a given link will have ID=1.
- Detector Label: Text string entered by user.
- Travel Direction: Text string entered by user.
- Link ID: ID of link containing subject detector.
- The following values are unique to each vehicle actuation; thus, they will change from one row (record) to the next.
- Vehicle ID: ID of vehicle that crossed detector.
- Actuation Time On (s): Simulation time when front of vehicle passes detector's upstream edge.
- Actuation Time Off (s): Simulation time when rear of vehicle passes detector's downstream edge. A value of ‘-1’ indicates either 1) that the vehicle changed lanes after actuating the detector but before passing completely over the detector or 2) that the vehicle was still on the detector when the simulation ended.
- Vehicle Type Id: The number corresponding to the specific vehicle model. This value can be found in the Vehicles Base Info section of the Settings screen. For example, the 2006 Honda Civic Si is ID 1.
- Vehicle Length (ft): The length of the given vehicle model.
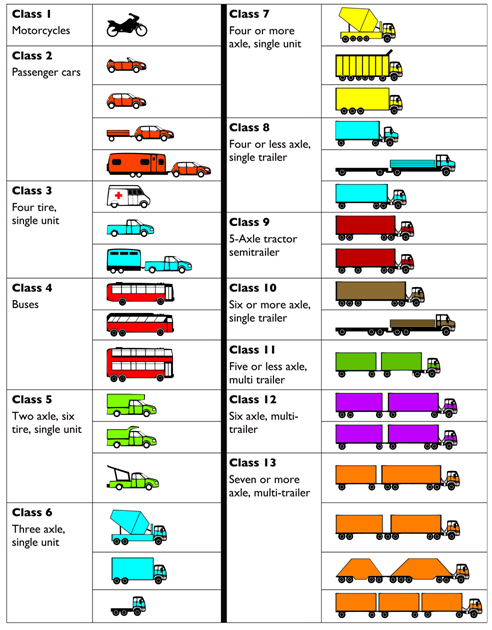
- FHWA Class: This value can be found in the Vehicles Base Info section of the Settings screen. It corresponds to the information at [FHWA classification]
- Speed (mi/h): The instantaneous speed of the vehicle at time of detector actuation on.
- Gap (ft): The distance between the current vehicle passing over the leading edge of the detector to the immediately in front of this vehicle. The gap distance is measured from the front end of the trail vehicle (i.e., at the detector) to the rear end of the leader vehicle. A value of '-1' indicates that there was no leader vehicle for the subject vehicle.
- Headway (s): The elapsed time between when the current vehicle passed over the leading edge of the detector and when the previous vehicle (i.e., leader vehicle) passed over the detector. The headway value is thus measured relative to the front end of each vehicle. A value of '0' indicates that there was no leader vehicle for the subject vehicle.
- Queue Status: The queuing state of the vehicle when it passed over the detector. The possible queuing states are listed here.
- Downstream Turn Dir: The assigned turning movement for the subject vehicle at the end of the link of which the subject detector is located.
- Vehicle ID: ID of vehicle that crossed detector.
Note that all detector actuations, during and after the warm-up time, are included in the results reported in this file.
Detector Aggregate Measures Data
This file contains aggregated detector measured values--that is, an aggregation of the results contained in the individual detector actuation files (described above). It is important to note that detector actuations that occur during the warm-up time are not included in the results reported in this file. The results for all detectors will be contained in a single file. The file is in a comma-separated value (CSV) format. The file will be named as follows:
"DetectorAggregateMeasures_ProjectName.csv"
where ProjectName will correspond to the name of your currently loaded project file (i.e., the *.ssim file).
This file will contain the following information
- Scenario: Corresponds to scenarios in a multi-run setup. If a single simulation run is made, this number will always be '1'.
- SubScenario: Corresponds to scenarios in a multi-run setup. If a single simulation run is made, this number will always be '0'.
- Replication: The replication number of a single run or the scenario from a multi-run setup.
- Link ID: ID of link containing subject detector.
- Lane ID: ID of lane within link containing subject detector.
- Detector ID: ID of subject detector. These values are unique to each link and lane. That is, the first detector placed in each lane of a given link will have ID=1.
- Detector Type: Detectors can be attached to signalized intersection controllers, ramp metering controllers, or unassigned (perform the basic measurement functions)
- Detector Label: Text string entered by user.
- Veh. Count Total: Total number of vehicles that crossed the detector during the simulation period.
- Flow rate (veh/h): The vehicle count total divided by the simulation period (in hours). For example, if the simulation period was 30 minutes, the flow rate values will double the vehicle count total values. Also see Performance Measures for more information.
- Avg. Speed (mi/h): See Performance Measures for more information.
- Avg. Speed (ft/s): The above measure converted from units of mi/h to ft/s.
- Std. Dev. of Speed (ft/s): The standard deviation of all measured speeds during the simulation period.
- Avg. Headway (s): The arithmetic average of all measured headways during the simulation period.
- Percent Followers: See Performance Measures for more information.
- Follower Density: See Performance Measures for more information.
- Occupancy (%): The percentage of time in which the detector was activated (i.e., a vehicle present on the detector) relative to the simulation period. See Performance Measures for more information.
- % Time Int Q Override Active: Specific to ramp metering applications. Details forthcoming.
- % Time Adv Q Override Active: Specific to ramp metering applications. Details forthcoming.
- FHWA Class 1-13 Totals: Count of vehicles that crossed detector of the specified FHWA classification. [FHWA classification]
- Veh. Type 1-13 Totals: Count of vehicles that crossed detector of the specified vehicle type. This value can be found in the Vehicles Base Info section of the Settings screen. For example, the 2006 Honda Civic Si is ID 1.
Vehicle Time Step Data
This file, referred to as the vehicle TSD file, is in a comma-separated value (CSV) format and contains detailed vehicle data, for every simulation time step. These values can also be viewed in the animation when individual vehicle properties are displayed. The file is named “TSD__x_y_z”, where x corresponds to the scenario number, y corresponds to the sub-scenario number, and z corresponds to the replication number. The file provides detailed time-step vehicle properties. The basic structure of the file is as follows:
- Each row represents a single vehicle record for a single simulation time step (0.1 s).
- The records are in sequence of vehicle ID. That is, all records for vehicle ID 1 are presented first in the file, followed by all records for vehicle ID 2, and so on.
- The number of records for a given vehicle ID correspond to the number of time steps for which the vehicle was present on the network, minus the records for the timesteps during which the vehicle was on an entry link and exit link. Thus, the timestep for the first record for a vehicle ID will be larger than system entry time (column 27) and the timestep for the last record for a vehicle ID will be less than the system exit time (column 28).
Keep in mind that this file can get extremely large if many network links are selected for output, so it is generally recommended to output only the links for which you need to do a close examination of the vehicle properties and/or want to do some post-processing of the data.
The TSD file contains the following information (with units, as appropriate, in parentheses), in order from left to right as the fields are presented in the file:
- SimTime (s): Simulation time, referenced to start of the simulation--that is, the start of the warm-up time.
- Veh Index: The ID assigned to the vehicle. These numbers are unique and assigned in order that vehicles enter the system.
- Fleet Type: See Vehicles for more information.
- Veh Label: See Vehicles for more information.
- Veh Length (ft): See Vehicles for more information.
- Veh Width (ft): See Vehicles for more information.
- Driver Type: See Drivers for more information.
- Link ID: The ID of the link that the subject vehicle is currently traveling on.
- Target Link ID: The ID of the next link that the subject vehicle is destined for.
- Lane ID: The ID of the lane that the subject vehicle is currently traveling on.
- Target Lane ID: The ID of the lane that the subject vehicle will attempt to move to in the next time step.
- Lane Change Status: See Lane Changing for more information.
- Passing Status: See Two-Lane Highway Passing for more information.
- Leader ID: The ID of the vehicle immediately preceding the subject vehicle in the same lane.
- Follow ID: The ID of the vehicle immediately behind the subject vehicle in the same lane.
- Platoon Position: A vehicle is considered to be either a follower or leader. See Leader/Follower Status for more information.
- Acceleration Mode: See Acceleration Mode for more information.
- Acceleration (ft/s/s): Rate of acceleration of subject vehicle at the given time step.
- Desired Acceleration (ft/s/s): See Acceleration Mode for more information.
- Velocity (ft/s): Speed of subject vehicle at the given time step.
- Desired Speed (ft/s): See Desired Speed for more information.
- PositionX (ft): The distance in the x (horizontal) direction, relative to the entry node coordinate where the subject vehicle entered the system, where subject vehicle is currently located.
- PositionY (ft): The distance in the y (vertical) direction, relative to the entry node coordinate where the subject vehicle entered the system, where subject vehicle is currently located.
- Angle (deg): See Network Structure for more information.
- Link Position (ft): The current position of the subject vehicle on a link, relative to the upstream end of the link. This distance is measured to the front end of the vehicle. This distance ranges from 0 to the length of the link.
- Distance To Lead Vehicle (ft): The distance between the front end of the subject vehicle to the back end of a leader vehicle. A value of '-1' indicates that there is no leader vehicle for the subject vehicle at this time step.
- System Entry Time (s): Simulation time at which the subject vehicle entered the system (i.e., entered the upstream end of an entry link).
- System Exit Time (s): Simulation time at which the subject vehicle exited the system (i.e., exited the downstream end of an exit link).
- Cold Start: See Emissions and Fuel Consumption for more information.
- Vehicle Specific Power (VSP): See Emissions and Fuel Consumption for more information.
- Nitrogen Oxide (NOx): See Emissions and Fuel Consumption for more information.
- HydroCarbons (HC): See Emissions and Fuel Consumption for more information.
- Carbon Monoxide (CO): See Emissions and Fuel Consumption for more information.
- Fuel Use: See Emissions and Fuel Consumption for more information.
- Manifold Pressure: See Emissions and Fuel Consumption for more information.
- Mass Air Flow: See Emissions and Fuel Consumption for more information.
- Engine Load: See Emissions and Fuel Consumption for more information.
- Gear: See Maximum Acceleration for more information.
- Gear Ratio: See Maximum Acceleration for more information.
- RPM (revs/min): See Maximum Acceleration for more information.
- Torque (ft-lb): See Maximum Acceleration for more information.
- Power (ft-lb/s): See Maximum Acceleration for more information.
- Latitude: Currently not enabled.
- Longitude: Currently not enabled.
- Lane ID Right: ID of the lane immediately to the right of the lane that subject vehicle is currently traveling in. A value of zero means subject vehicle is currently in the right-most lane.
- Lane ID Left: ID of the lane immediately to the left of the lane that subject vehicle is currently traveling in. A value of zero means subject vehicle is currently in the left-most lane.
- Queue Status: A vehicle can be in one of four different states of queuing at each time step: NotInQueue, SlowingForQueue, StoppedInQueue, MovingInQueue, and QueueDischarge. The definitions of these states are based upon the guidance in the HCM 2016 [Chapter 36 (Concepts: Supplemental), page 42].
Signal Time Step Data
Generates a CSV file named “TSD_signal.csv” upon running a simulation. The file provides the signal phase status for every simulation time step, for every signal in the network, to a comma-separated value (CSV) file.
The (CSV) file will contain the following information
- Signal ID
- Simulation Time
- Phase Number
- Status
- Interval
- Time Remain
Ramp Metering Data
Outputs details of the ramp metering controller and its associated control detectors. One comma-separated value (CSV) file will be created for each ramp metering controller. Each CSV file will be named as follows:
"RampMeteringIntervalData_ControllerId_k_x_y_z.csv"
where: k corresponds to the ramp controller ID, x corresponds to the scenario number, y corresponds to the subscenario number, and z corresponds to the replication number.
The (CSV) file will contain the following information:
- Time(s): This will be in 30-s increments, which is the ramp metering rate calculation update interval
- Ramp Controller ID: These values correspond to ID value in signal timing data file
- Controller Phase ID: The number of phase ID’s will correspond to the number of lanes served
- Metering Rate (veh/h): Calculated metering rate. If more than one lane is controlled by meter (which means there will be more than one phase ID), the metering rate is divided by the number of lanes. For example, if the metering rate is set of a minimum value of 240 veh/h, and meter serves two lanes, the metering rate per phase will be set to 120 veh/h. The proportional split of the overall metering rate between the phases can be changed by the user, but by default, is split evenly across the number of lanes (e.g., 0.5 for two metered lanes).
There will only be one instance of the above four column headings. The following column headings will repeat for each detector associated with the given ramp controller phase ID, as follows.
- Det Link ID: Link on which detector is present
- Det Lane ID: Lane on which detector is present
- Det ID: ID number for detector
- Det Function: This will be either…
- RampMeterPresence: Detector immediately upstream of ramp meter stop bar
- RampMeterQueueIntermediate: Detector placed approximately 500 ft upstream of ramp meter stop bar
- RampMeterQueueAdvance: Detector placed near the arterial/on-ramp junction
- Det Occ Interval(%):
- Det Occ Cumulative(%):
A "RampMeteringSummaryData.csv" file is also output. This file provides the percentage of time, over the simulation period, that the metering rate was set to one of three values (base, intermediate queue, advance queue).
Lane Change Data
Outputs details of the lane change maneuvers, to a comma-separated value (CSV) file.
The basic structure of the file is as follows:
- Each row represents a single vehicle record for a single simulation time step (0.1 s).
- The records are in sequence of vehicle ID. That is, all records for vehicle ID 1 are presented first in the file, followed by all records for vehicle ID 2, and so on.
- The number of records for a given vehicle ID correspond to the number of time steps for which the vehicle was present on the network, minus the records for the timesteps during which the vehicle was on an entry link and exit link. Thus, the timestep for the first record for a vehicle ID will be larger than system entry time (column 27) and the timestep for the last record for a vehicle ID will be less than the system exit time (column 28).
The (CSV) file will contain the following information
- Vehicle ID
- Time Index
- Link ID
- Lane Change Motivation
- Future Passing Mode
- Desired Lane ID
- Subject Vehicle Makes a lane change?
- Subject Vehicle Link Position
- Subject Vehicle Velocity
- Subject Vehicle Acceleration
- Subject Vehicle Urgency Factor
- Subject Vehicle Acceptable Risk
- ID of Lead Vehicle on Desired Lane
- ID of Following Vehicle on Desired Lane
- Velocity of Lead Vehicle on Desired Lane
- Velocity of Following Vehicle on Desired Lane
- Distance between Subject Vehicle and Lead Vehicle on Desired Lane
- Distance between Following Vehicle on Desired Lane and Subject Vehicle
- Actual Risk of Subject Vehicle with Respect to Lead Vehicle on Desired Lane
- Actual Risk of Follow Vehicle on Desired Lane with Respect to Subject Vehicle
- Subject Vehicle Is Able to Avoid Collision with Lead Vehicle on Desired Lane?
- Follow Vehicle on Desired Lane Is Able to Avoid Collision with Subject Vehicle?
- Lead Gap Is Acceptable?
- Lag Gap Is Acceptable?
Platoon Data
Outputs vehicle platoon measurements, to a comma-separated value (CSV) file.
Emissions and Fuel Consumption Data
The simulation will calculate detailed vehicle emissions and fuel consumption data, for every simulation time step. These values can be viewed in the animation, as well as the vehicle time step data output file (if selected for output).